Financial markets often appear complex because many underlying factors influence price movements. One of the most important concepts traders use to evaluate the strength of a market trend is Market Breadth. While index movements show the overall direction of the market, Market Breadth helps reveal what is actually happening beneath the surface by analyzing how many stocks are participating in the trend.
Understanding Market Breadth can help traders identify the true strength of a rally, detect potential reversals, and make more informed investment decisions. This comprehensive guide explores what Market Breadth is, how it works, the most important indicators, and how traders use it to analyze market trends.
What is Market Breadth?
Market Breadth shows how many stocks are involved in a market movement. Instead of focusing solely on index performance, it evaluates whether a large portion of stocks are moving in the same direction as the broader market.
For example, if a stock index like the Dow Jones Industrial Average rises but only a few large companies are responsible for the gains, the rally may not be as strong as it appears. Strong Market Breadth occurs when a large number of stocks move upward together, confirming the market trend.
In contrast, weak Market Breadth indicates that only a small number of stocks are driving market performance, which could signal potential weakness or an upcoming reversal.
Why Market Breadth is Important in Market Analysis?
Traders and investors rely on it because it provides deeper insights than index movements alone. A handful of large companies can sometimes influence major market indices, masking underlying weakness in the broader market.
Key benefits include:
- Confirming the strength of market trends
- Identifying divergence between stock indices and individual stocks
- Detecting early warning signs of market reversals
- Improving timing for entry and exit points
- Understanding overall investor participation in the market.
For example, traders often monitor pre-market indicators and futures activity alongside Market Breadth tools. Some analysts also review the Dow Jones futures chart to gauge overnight sentiment and compare it with internal market indicators before the trading session begins.
Key Market Breadth Indicators
Traders use different indicators to measure Market Breadth, and each one shows how many stocks are participating in market movements.
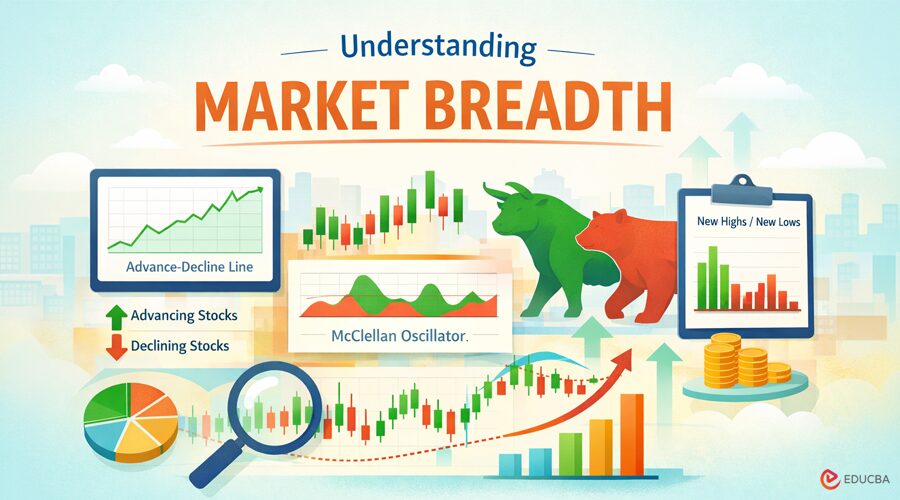
1. Advance–Decline Line (A/D Line)
The Advance–Decline Line is one of the most widely used Market Breadth indicators. It measures the difference between advancing stocks (stocks that close higher) and declining stocks (stocks that close lower).
When the A/D line rises along with the market index, it indicates strong Market Breadth because many stocks are participating in the rally. However, if the index rises while the A/D line declines, it suggests weakening participation and potential market instability.
2. Advance–Decline Ratio
The Advance–Decline Ratio shows how many stocks are rising compared to those falling during a trading session.
For instance:
- Ratio above 1: more stocks rising than falling
- Ratio below 1: more stocks declining than advancing
A high ratio signals strong bullish Market Breadth, while a low ratio may indicate bearish sentiment.
3. New Highs vs. New Lows
Another valuable indicator measures the number of stocks reaching new 52-week highs compared to those hitting new lows.
A market rally supported by a large number of new highs indicates strong Market Breadth. On the other hand, if fewer stocks are making new highs while the index continues rising, the rally could be losing momentum.
4. McClellan Oscillator
The McClellan Oscillator is a momentum-based Market Breadth indicator derived from advancing and declining stock data.
This indicator helps traders identify:
- Overbought market conditions
- Oversold market conditions
- Shifts in market momentum.
Positive readings typically indicate strong Market Breadth, while negative readings suggest bearish pressure.
5. Arms Index (TRIN)
The Arms Index, also known as TRIN, measures the relationship between advancing/declining stocks and advancing/declining volume.
Key interpretations include:
- TRIN below 1: bullish market sentiment
- TRIN above 1: bearish market sentiment
This indicator provides insight into whether trading volume aligns with the market’s direction.
How Traders Use Market Breadth in Trading Strategies?
Professional traders often combine Market Breadth indicators with technical analysis and fundamental research to gain a more comprehensive view of the market.
1. Confirming Market Trends
Strong Market Breadth confirms the sustainability of a market trend. When a broad range of stocks supports a rally, the trend is more likely to continue.
2. Identifying Market Divergence
Divergence occurs when the market index moves in one direction while Market Breadth indicators move in the opposite direction.
For example:
- Index rising but breadth declining: potential weakness
- Index falling but breadth improving: potential recovery
Divergence often signals a potential turning point in the market.
3. Timing Market Entries
Many traders use it to determine optimal entry points. Strong breadth signals confirm bullish trades, while weak breadth may encourage caution.
Market Breadth and Sector Rotation
Another powerful application of Market Breadth is identifying sector rotation. Different sectors perform better during various stages of the economic cycle.
For example:
- Technology and growth sectors often lead during early expansion
- Financials and industrials may perform well during strong economic growth
- Defensive sectors like utilities and consumer staples may outperform during market uncertainty.
By analyzing Market Breadth across sectors, investors can identify which industries are gaining momentum and adjust their portfolios accordingly.
Limitations of Market Breadth Indicators
Traders should not use Market Breadth in isolation, even though it provides valuable insights. Numerous factors, including economic data, geopolitical developments, and central bank policies, influence markets.
Some limitations include:
- Indicators may produce false signals in volatile markets
- Breadth data may lag during rapid market movements
- Interpretation can vary depending on the timeframe used.
Therefore, traders typically combine Market Breadth with other technical tools such as trend analysis, volume indicators, and momentum oscillators.
Tips for Using Market Breadth Effectively
To maximize the value of Market Breadth analysis, traders should consider several best practices.
- Combine multiple indicators: Using several indicators together provides a clearer picture of market conditions and reduces the risk of relying on a single signal.
- Analyze different timeframes: Short-term traders may focus on daily Market Breadth signals, while long-term investors may analyze weekly or monthly trends.
- Monitor market context: Always evaluate Market Breadth alongside economic events, earnings reports, and macroeconomic conditions.
- Use breadth as confirmation: Rather than relying on Market Breadth alone, use it to confirm signals generated by other technical or fundamental analysis methods.
The Role of Market Breadth in Modern Trading
With the growth of algorithmic trading and advanced analytics, it remains a critical tool for evaluating market participation. Institutional investors, hedge funds, and professional traders continue to rely on Market Breadth indicators to assess overall market health.
By revealing how many stocks support a trend, it provides a clearer picture of whether market movements are driven by broad participation or by a small group of dominant companies.
Final Thoughts
Understanding Market Breadth is essential for anyone involved in financial markets. While price indices provide a snapshot of market performance, it reveals the deeper structure behind those movements.
By analyzing indicators such as the Advance–Decline Line, New Highs vs. New Lows, and the McClellan Oscillator, traders can assess trend strength, identify potential reversals, and improve decision-making.
When traders combine Market Breadth with other tools and market data, they can better understand the stock market and make smarter trading and investment decisions.
Recommended Articles
We hope this guide on Market Breadth helps you understand how traders analyze market participation and confirm the strength of stock market trends. Explore the recommended articles below for insights on technical indicators, market sentiment, and effective trading strategies.
