How to Create Professional Charts Instantly for Free?
In the data-driven world, the ability to present information effectively is a superpower. However, many students and professionals find themselves trapped between two extremes: complex, expensive software with a steep learning curve, or basic tools that offer little customization. LiveGap Charts bridges this gap by offering a powerful, browser-based solution that allows you to create professional charts online for free with no registration, downloads, or subscriptions required.
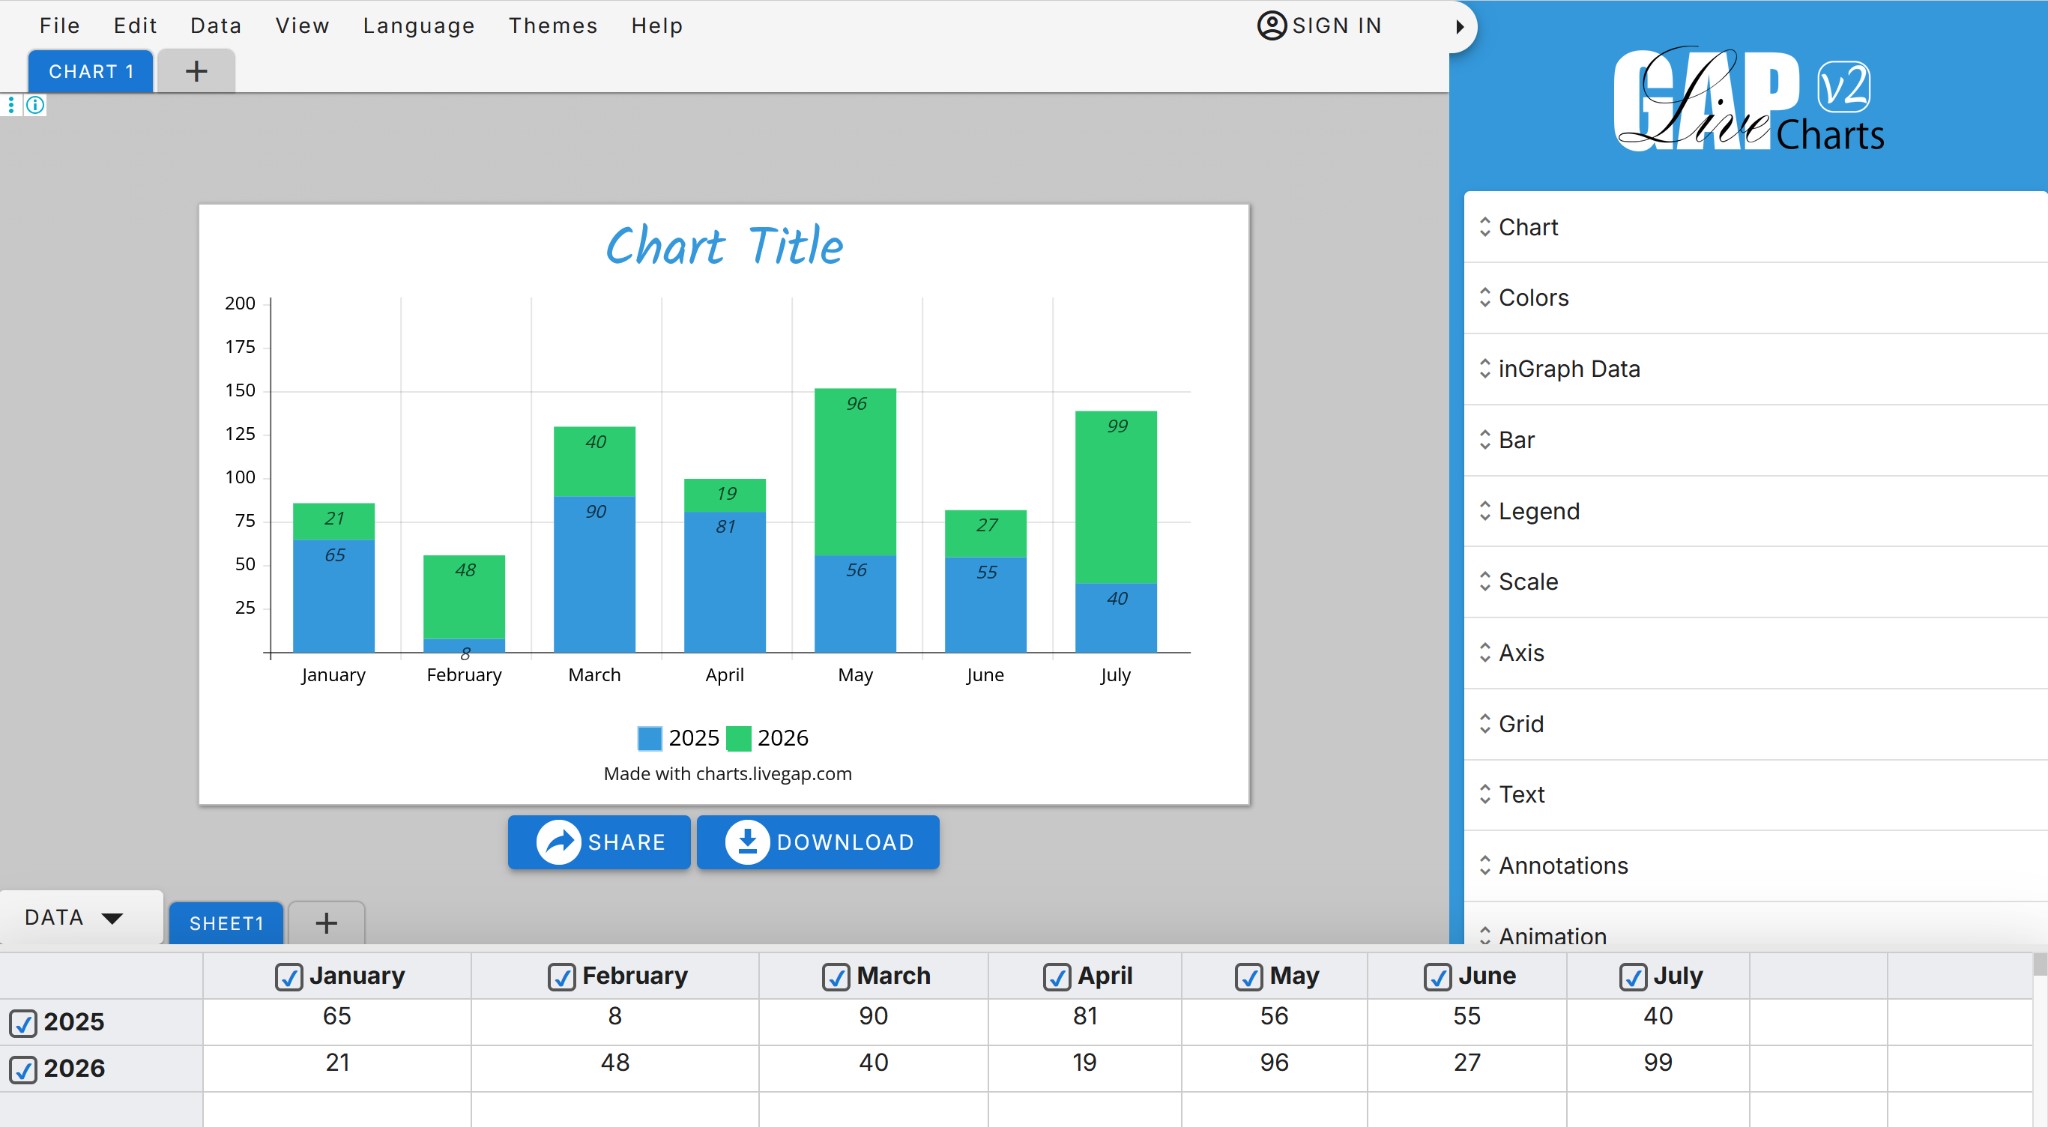
Image Source: LiveGap Charts
Why Data Visualization is a Must-Have Skill?
Raw numbers can be overwhelming and easily ignored. Research shows that visual data improves retention and speeds up decision-making. Whether you are building a business report or a classroom project, a clear graph communicates trends that a table simply cannot. For those looking for a free alternative to Canva charts or complex spreadsheet tools, LiveGap Charts provides a streamlined, professional-grade solution.
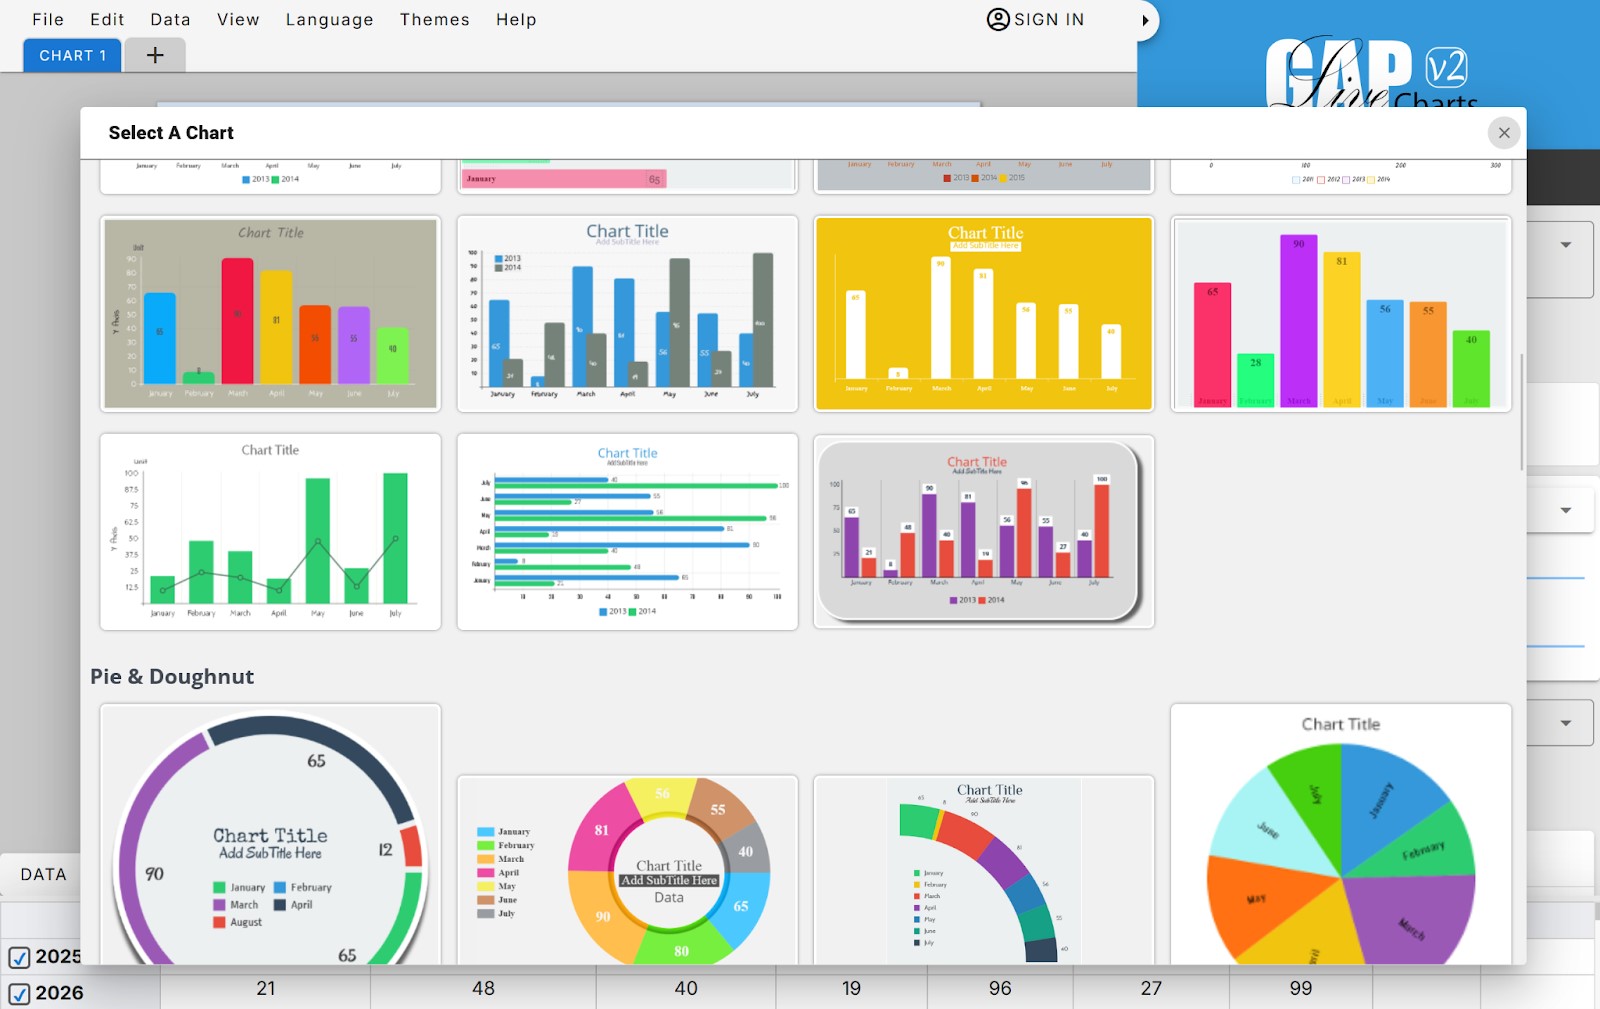
Image Source: LiveGap Charts
What Makes LiveGap Charts Stand Out?
LiveGap Charts delivers speed and flexibility beyond traditional software. It is a no-registration chart maker that respects your time and privacy.
- Completely Free & Accessible: Start creating immediately in your browser without hitting a paywall.
- Unique Customization: Go beyond basic bars. Use icon-based charts to add visual metaphors to your data, making it more engaging for your audience.
- Diverse Chart Library: Choose from line, bar, stacked, radar, polar area, pie, and doughnut charts.
- Responsive Design: Build charts that look perfect on any device, from desktop presentations to mobile screens.
How to Create Professional Chart in 3 Simple Steps?
The platform is designed to be a user-friendly chart creator that saves you hours of manual formatting:
- Select Your Template: Choose your preferred style, from classic Bar charts to advanced Radar or Icon-based layouts.
- Input Your Data: Save time by importing CSV or Excel files, or simply copy-paste your data directly into the editor.
- Customize & Export: Adjust colors, fonts, and scales to match your brand or project theme, then download your high-resolution image instantly.
Built for Students, Educators, and Professionals
- Students: Quickly visualize research data or survey results for assignments.
- Educators: Create interactive teaching materials and classroom dashboards that keep students engaged.
- Business Professionals: Build high-impact sales reports and marketing dashboards without needing a graphic design degree.
Final Thoughts
Stop relying on outdated tools and complicated software. With LiveGap Charts, you can easily create professional charts online for free and turn raw data into meaningful insights. Explore the platform today and discover how simple it is to create professional charts that stand out and make an impact.
Recommended Articles
We hope this guide helps you create professional charts effortlessly for your projects and presentations. Check out our recommended articles for more insights and strategies to enhance your data visualization skills.
