What Is a Categorical Variable?
A categorical variable represents characteristics or attributes that divide data into distinct groups or categories. Unlike numerical variables, which measure quantity, categorical variables describe qualitative properties, such as color, type, or brand.
Each category represents a label, and these labels do not have any inherent numerical meaning.
For example, a survey asking about favorite fruit may include categories like Apple, Banana, Mango, and Orange. These labels classify data but cannot be measured or ranked unless specified.
Categorical variables are extensively used in statistics, marketing, psychology, and data science to classify data and uncover trends among different groups.
Table of Contents
- Meaning
- Types
- Categorical vs. Numerical Variables
- Examples
- How to Analyze?
- Encoding
- Importance
- Common Mistakes to Avoid
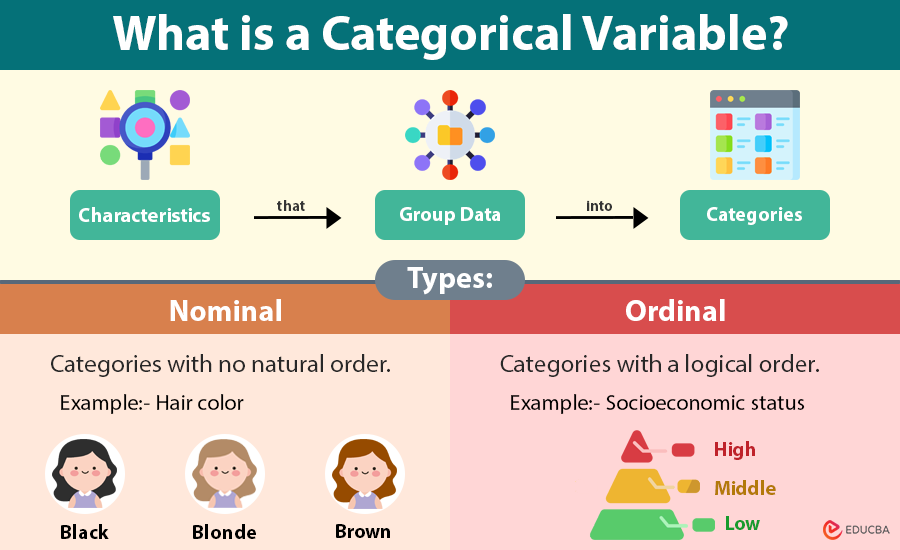
Types of Categorical Variables
We can divide categorical variables into two main types: Nominal and Ordinal. Both represent qualitative data, but the difference lies in whether the categories have an inherent order.
1. Nominal Variables
Nominal variables are categorical variables in which the categories have no inherent order or ranking. The labels are purely identifiers used to classify or name items.
For instance, the variable “eye color” may include the values blue, brown, green, gray, and black. These are distinct categories, but one color is not greater or lesser than another; they are just different.
Key Characteristics:
- Categories cannot be ranked.
- Used for labeling or naming purposes.
- You cannot use arithmetic operations like addition or averaging on them.
Examples:
- Hair color: Black, Blonde, Red, Brown
- City: Delhi, Mumbai, Chennai, Kolkata
- Type of car: SUV, Sedan, Hatchback, Truck
We often use bar charts or pie charts to display nominal data and illustrate the frequency with which each category appears.
2. Ordinal Variables
Ordinal variables represent categories that have a meaningful order or ranking among them. However, the difference between each level is not necessarily uniform or measurable.
For example, in customer satisfaction surveys:
- Very Satisfied, Satisfied, Neutral, Dissatisfied, Very Dissatisfied.
Here, the order matters; “Very Satisfied” is higher than “Neutral,” but the gap between categories is subjective and cannot be precisely quantified.
Key Characteristics:
- Categories have a logical order.
- Intervals between categories are not consistent.
- Often used in surveys, education, and customer feedback systems.
Examples:
- Education level: High School, Graduate, Postgraduate, Doctorate
- Socioeconomic status: Low, Middle, High
- Ratings: Poor, Fair, Good, Excellent
Ordinal data helps identify trends or levels of agreement, satisfaction, or achievement.
Categorical vs. Numerical Variables
It is crucial to differentiate between categorical variables and numerical variables, as each serves a different purpose in data analysis.
| Feature | Categorical Variable | Numerical Variable |
| Nature | Qualitative | Quantitative |
| Values Represent | Labels or groups | Numeric quantities |
| Mathematical Operations | Not applicable | Applicable |
| Examples | Gender, Country, Color | Age, Income, Temperature |
| Visualization Tools | Bar chart, Pie chart | Histogram, Scatter plot |
Categorical variables classify data, while numerical variables measure data. In data analytics, understanding the difference is crucial for selecting the correct model and conducting accurate statistical analysis.
Examples of Categorical Variables
Categorical variables appear in almost every dataset across different industries. Below are examples by domain:
1. Business & Marketing
- Customer type: New, Returning, VIP
- Product category: Electronics, Apparel, Home Goods
- Payment mode: Cash, Card, Digital Wallet.
2. Healthcare
- Blood type: A, B, AB, O
- Disease type: Viral, Bacterial, Fungal
- Treatment plan: Surgery, Medication, Therapy.
3. Education
- Grade: A, B, C, D, F
- Course type: Online, Offline, Hybrid
- Degree level: Bachelor’s, Master’s, PhD.
4. Technology
- Operating system: Windows, macOS, Linux
- Device type: Mobile, Tablet, Laptop
- Subscription tier: Free, Basic, Premium.
These examples demonstrate how categorical variables facilitate the classification and segmentation of data, enabling improved interpretation.
How to Analyze Categorical Variables?
Analyzing categorical variables involves summarizing, visualizing, and comparing categories. Some common methods include:
1. Frequency Tables
A frequency table counts the number of times each category appears in the dataset.
Example:
| Color | Frequency |
| Red | 25 |
| Blue | 30 |
| Green | 20 |
It helps identify the most and least common categories at a glance.
2. Bar Charts
A bar chart is ideal for visualizing categorical data. Each bar shows a category, and its height indicates how often it appears or what share it has. It is one of the most effective ways to highlight comparisons between groups.
3. Pie Charts
Pie charts display proportions as parts of a whole. While visually appealing, they are most effective when the number of categories is small and the differences are significant.
4. Cross-Tabulation (Contingency Tables)
Cross-tabulation helps explore relationships between two categorical variables.
Example: analyzing the relationship between gender and preferred payment method in a customer survey.
5. Chi-Square Test
The Chi-square test helps check whether two categorical variables are connected or independent. For instance, it can test if gender influences product preference.
Encoding Categorical Variables
Machine learning models typically require numeric inputs. Therefore, we need to convert categorical data into numerical form using encoding.
1. Label Encoding
This method assigns a unique number to each category.
Example:
Fruit → Apple = 0, Banana = 1, Mango = 2
Useful for ordinal data where the order of the data matters.
2. One-Hot Encoding
This method creates binary columns for each category (0 or 1).
Example:
| Red | Blue | Green |
| 1 | 0 | 0 |
| 0 | 1 | 0 |
| 0 | 0 | 1 |
Ideal for nominal variables where order does not matter.
3. Target Encoding
Replaces categories with the mean of the target variable. Common in predictive modeling, but requires caution to prevent overfitting.
Encoding ensures models can interpret categorical data effectively while maintaining relationships and meaning.
Importance of Categorical Variables
Categorical variables play a critical role in:
- Market research: Segmenting customers by gender, location, or buying preference.
- Predictive analytics: Serving as key inputs in classification models (e.g., predicting churn or default).
- Business strategy: Helping identify target markets and product performance by category.
- Healthcare: Classifying patients by treatment, diagnosis, or risk category.
- Education: Grouping students by performance levels or learning modes.
Without categorical variables, data would lack context, making it difficult to draw actionable insights.
Common Mistakes to Avoid
- Ignoring data type: Treating ordinal variables as if they were nominal can lead to incorrect analysis and interpretation.
- Skipping encoding: Feeding raw text categories directly into machine learning models.
- Unbalanced categories: Failing to address skewed datasets where one category dominates.
- Too many levels: Having too many unique categories can make models complex and harder to interpret.
Correct preprocessing and analysis help avoid bias and improve data reliability.
Final Thoughts
A categorical variable represents data divided into meaningful groups or categories, forming the backbone of data analysis, market segmentation, and predictive modeling. Understanding the types of data (nominal and ordinal), as well as the methods of analysis and encoding techniques, is crucial for any data professional or analyst.
By analyzing categorical variables effectively, businesses and researchers can extract deeper insights, detect hidden patterns, and make more informed decisions.
Frequently Asked Questions (FAQs)
Q1. Why are categorical variables important in data analysis?
Answer: Categorical variables are important because they help classify and organize data into meaningful groups. This makes it easier to identify patterns, compare segments, and make data-driven decisions in research, business, and machine learning.
Q2. What are high-cardinality categorical variables?
Answer: High-cardinality categorical variables have a large number of unique categories (e.g., zip codes, customer IDs). They can make models complex and memory-intensive. Common solutions include target encoding, frequency encoding, or grouping rare categories into an “Other” class.
Q3. Can categorical variables have numeric labels?
Answer: Yes, categorical variables can use numbers as labels (like jersey numbers or ID codes), but those numbers do not represent quantity or order. We still treat them as categories, not numerical values.
Q4. How do you choose between label encoding and one-hot encoding?
Answer: Use label encoding when the categorical variable is ordinal (order matters), and use one-hot encoding when the variable is nominal (no order). Choosing the wrong encoding method can lead to misleading results for your model.
Q5. How do categorical variables interact with numerical variables?
Answer: Analysts often use techniques such as grouped summaries, box plots, or ANOVA tests to study relationships between categorical and numerical variables, such as how income (a numerical variable) varies by education level (a categorical variable).
Recommended Articles
We hope this guide on categorical variables helps you understand how qualitative data is classified, analyzed, and used in data-driven research. Explore these articles for deeper insights into data types, statistical analysis, and effective data preprocessing techniques in data science.

