Updated March 8, 2023

Introduction to Matlab Magnitude of Vector
The definition of magnitude of vector Matlab is a quantity with both direction and magnitude called a vector. In the study of motion these both vector quantities play a very important role. Force, velocity, acceleration, displacement and momentum are the some of examples of vector quantities. The magnitude of a vector is that the length of the vector s. The magnitude of the vector is denoted as ∥b∥.
Syntax of Matlab Magnitude of Vector
You can use the following syntaxes to generating a magnitude vector:
u1 = [ 1 : 2 : 22 ] ;
su1 = u1 .* u1 ;
p1 = sum ( su1 ) ;
mag1 = sqrt ( p1 )
el = abs(D)
- el = abs(D) returns the absolute value of each element in array D.
- If D is complex, abs(D) returns the complex magnitude.
How to do Magnitude of Vector Matlab?
Magnitude of a vector u with elements u1, u2, u3, …, un, is given by the equation:
You need to take the following steps to calculate the magnitude of a vector:
- Take the product of the vector with itself, using array multiplication( .* ). This produces a vector su, whose elements are squares of the elements of vector u.
- Use the sum function to get the sum of squares of elements of vector u. This is also called the dot product of vector u.
- Use the sqrt function to get the square root of the sum, which is also the magnitude of the vector u.
The magnitude of a Vector Formula:
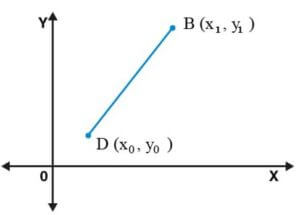
Suppose DB is a vector quantity that has magnitude and direction both. To calculate the magnitude of the vector DB, we have to calculate the distance between the initial point D and endpoint B. In the X-Y plane, let D has coordinates (x0,y0) and B has coordinates (x1,y1).
Therefore, by distance formula, the magnitude of vector →DB can be written as:
Now, if the endpoint B is at the origin, then the magnitude of a vector formula becomes:
Examples of Matlab Magnitude of Vector
Given below are the examples of Matlab Magnitude of Vector:
Example #1
Let us consider one example; in this example, we can create one vector, ‘u’. Then we take a dot product (.*) of vector u with itself. This produces a vector ‘su’ whose elements are square of the element of vector u. Then we use the sum function to get the sum of the square of elements of vector u. Then we use the square root function to get a magnitude of vector u and display it by using the disp function.
Code:
clc ;
clear all ;
u = [ 2 : 4 : 22 ] ;
su = u .* u ;
p = sum ( su ) ;
mag = sqrt ( p ) ;
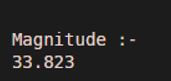
disp ( ' Magnitude :- ' );
disp ( mag );
Output :
Example #2
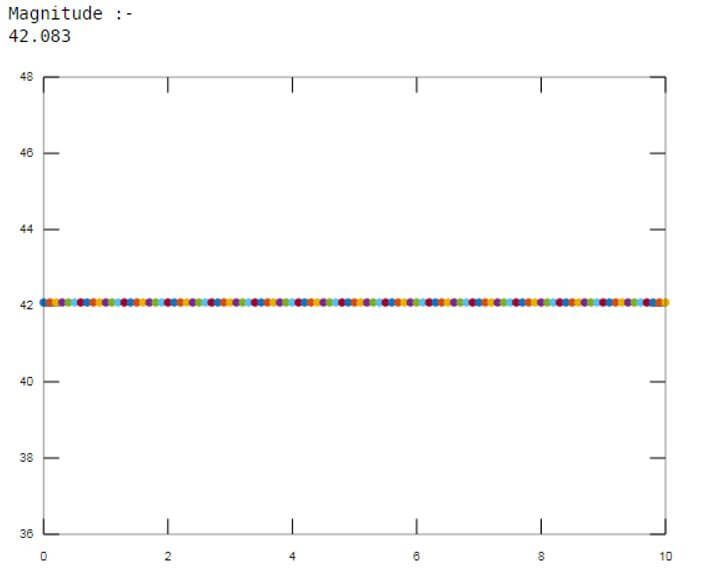
Let us one another example; in the first example, we can only display vector magnitude value. But in this example, we can also plot the graph for the vector magnitude. For that, we can first create one vector u1. Square the vector u1 by taking the dot product of vector u1 with itself, and the resultant will be stored in su1. Then using the sum function, we can sum of the square of the element vector u1. And then, using the sqrt function, we get the magnitude. For the plotting the graph, we will use the plot inbuilt function in Matlab. For this function, we can first decide the time scale as per requirement; let us assume the time scale be 0: 0.1:10. Then we can use the plot function with time and magnitude (mag) to see the graph.
Code:
clc ;

clear all ;

close all ;

time = 0: 0.1:10;

u1 = [ 1 : 2 : 22 ] ;

su1 = u1 .* u1 ;

p1 = sum ( su1 ) ;

mag1 = sqrt ( p1 ) ;

disp ( ' Magnitude :-  ' );

disp ( mag1 );

plot ( time , mag1 );
Output:
Example #3
Let us see one another example, to create Absolute value and complex magnitude using vector magnitude. Create a numeric vector of real values ( Absolute Value of Scalar).
Code:
clc;
clear all;
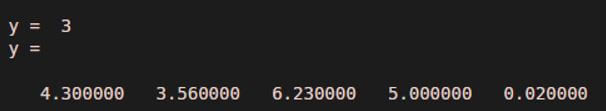
y = abs(-3)
x = [4.3 -3.56 6.23 -5 -0.02];
y = abs(x)
Output:
Conclusion
In this article, we have seen that how to use the vector magnitude function use in Matlab. It can be generated the magnitude of a vector is that the length of the vector in Matlab, and by using a reference of another vector with other major terminologies in programming. By using the vector magnitude function, we can find the magnitude of a vector that is the length of the vector.
Recommended Articles
This is a guide to Matlab Magnitude of Vector. Here we discuss the introduction, how to do magnitude of vector Matlab? and examples, respectively. You may also have a look at the following articles to learn more –
