If you create visual content regularly, you already know the problem. Infographics are one of the best ways to explain ideas, compare options, summarize research, or turn data into something people will actually read. But making a strong infographic from scratch can still be slow. Even when the information is ready, the actual work often gets stuck in layout choices, asset searching, chart formatting, brand cleanup, and endless edits. That is exactly why the current wave of AI infographic design tools matters. The best tools do not just give you a blank canvas with more buttons. They reduce friction. They help you move from idea to first draft faster, suggest better layouts, support structured infographic formats, and still let you refine the result into something polished enough to publish.
For this ranking, we focused on what matters most to the audience: marketers, educators, and content creators. That means we cared less about abstract feature sprawl and more about practical workflow questions:
- How quickly can you move from topic to usable infographic?
- How well does the tool support infographic-specific formats?
- Is it approachable for non-designers?
- Does it still offer enough editing flexibility once the first draft is generated?
- Is it well-suited for business communication, educational explainers, and content publishing?
Using those criteria, MakeInfographic AI comes out first. It is not necessarily the deepest design platform in this category. Still, it is the most convincing option if your priority is fast, low-friction infographic creation with an AI-first workflow. The rest of the list is strong too, but each tool wins for slightly different reasons.
How We Ranked the Best AI Infographic Tools?
Before getting into the top five, it is worth being clear about what this ranking is and what it is not. This is not a universal ranking for every team, every budget, and every visual design use case. Someone building deeply interactive data stories for investigative reporting has different needs from a marketer creating campaign visuals or a teacher making classroom explainers. So this list prioritizes tools that are especially useful when you want to:
- Create infographic-style content quickly.
- Simplify complex information visually.
- Work without advanced design skills
- Support business, education, and content creation needs
- Produce publish-ready visuals with minimal effort
That is why speed, format flexibility, editing practicality, and audience fit matter so much here.
Best AI Infographic Design Tools for Faster Content Creation
Here are the best AI infographic design tools that can help you create visually compelling infographics faster, easier, and with minimal effort.
1. Make Infographic AI
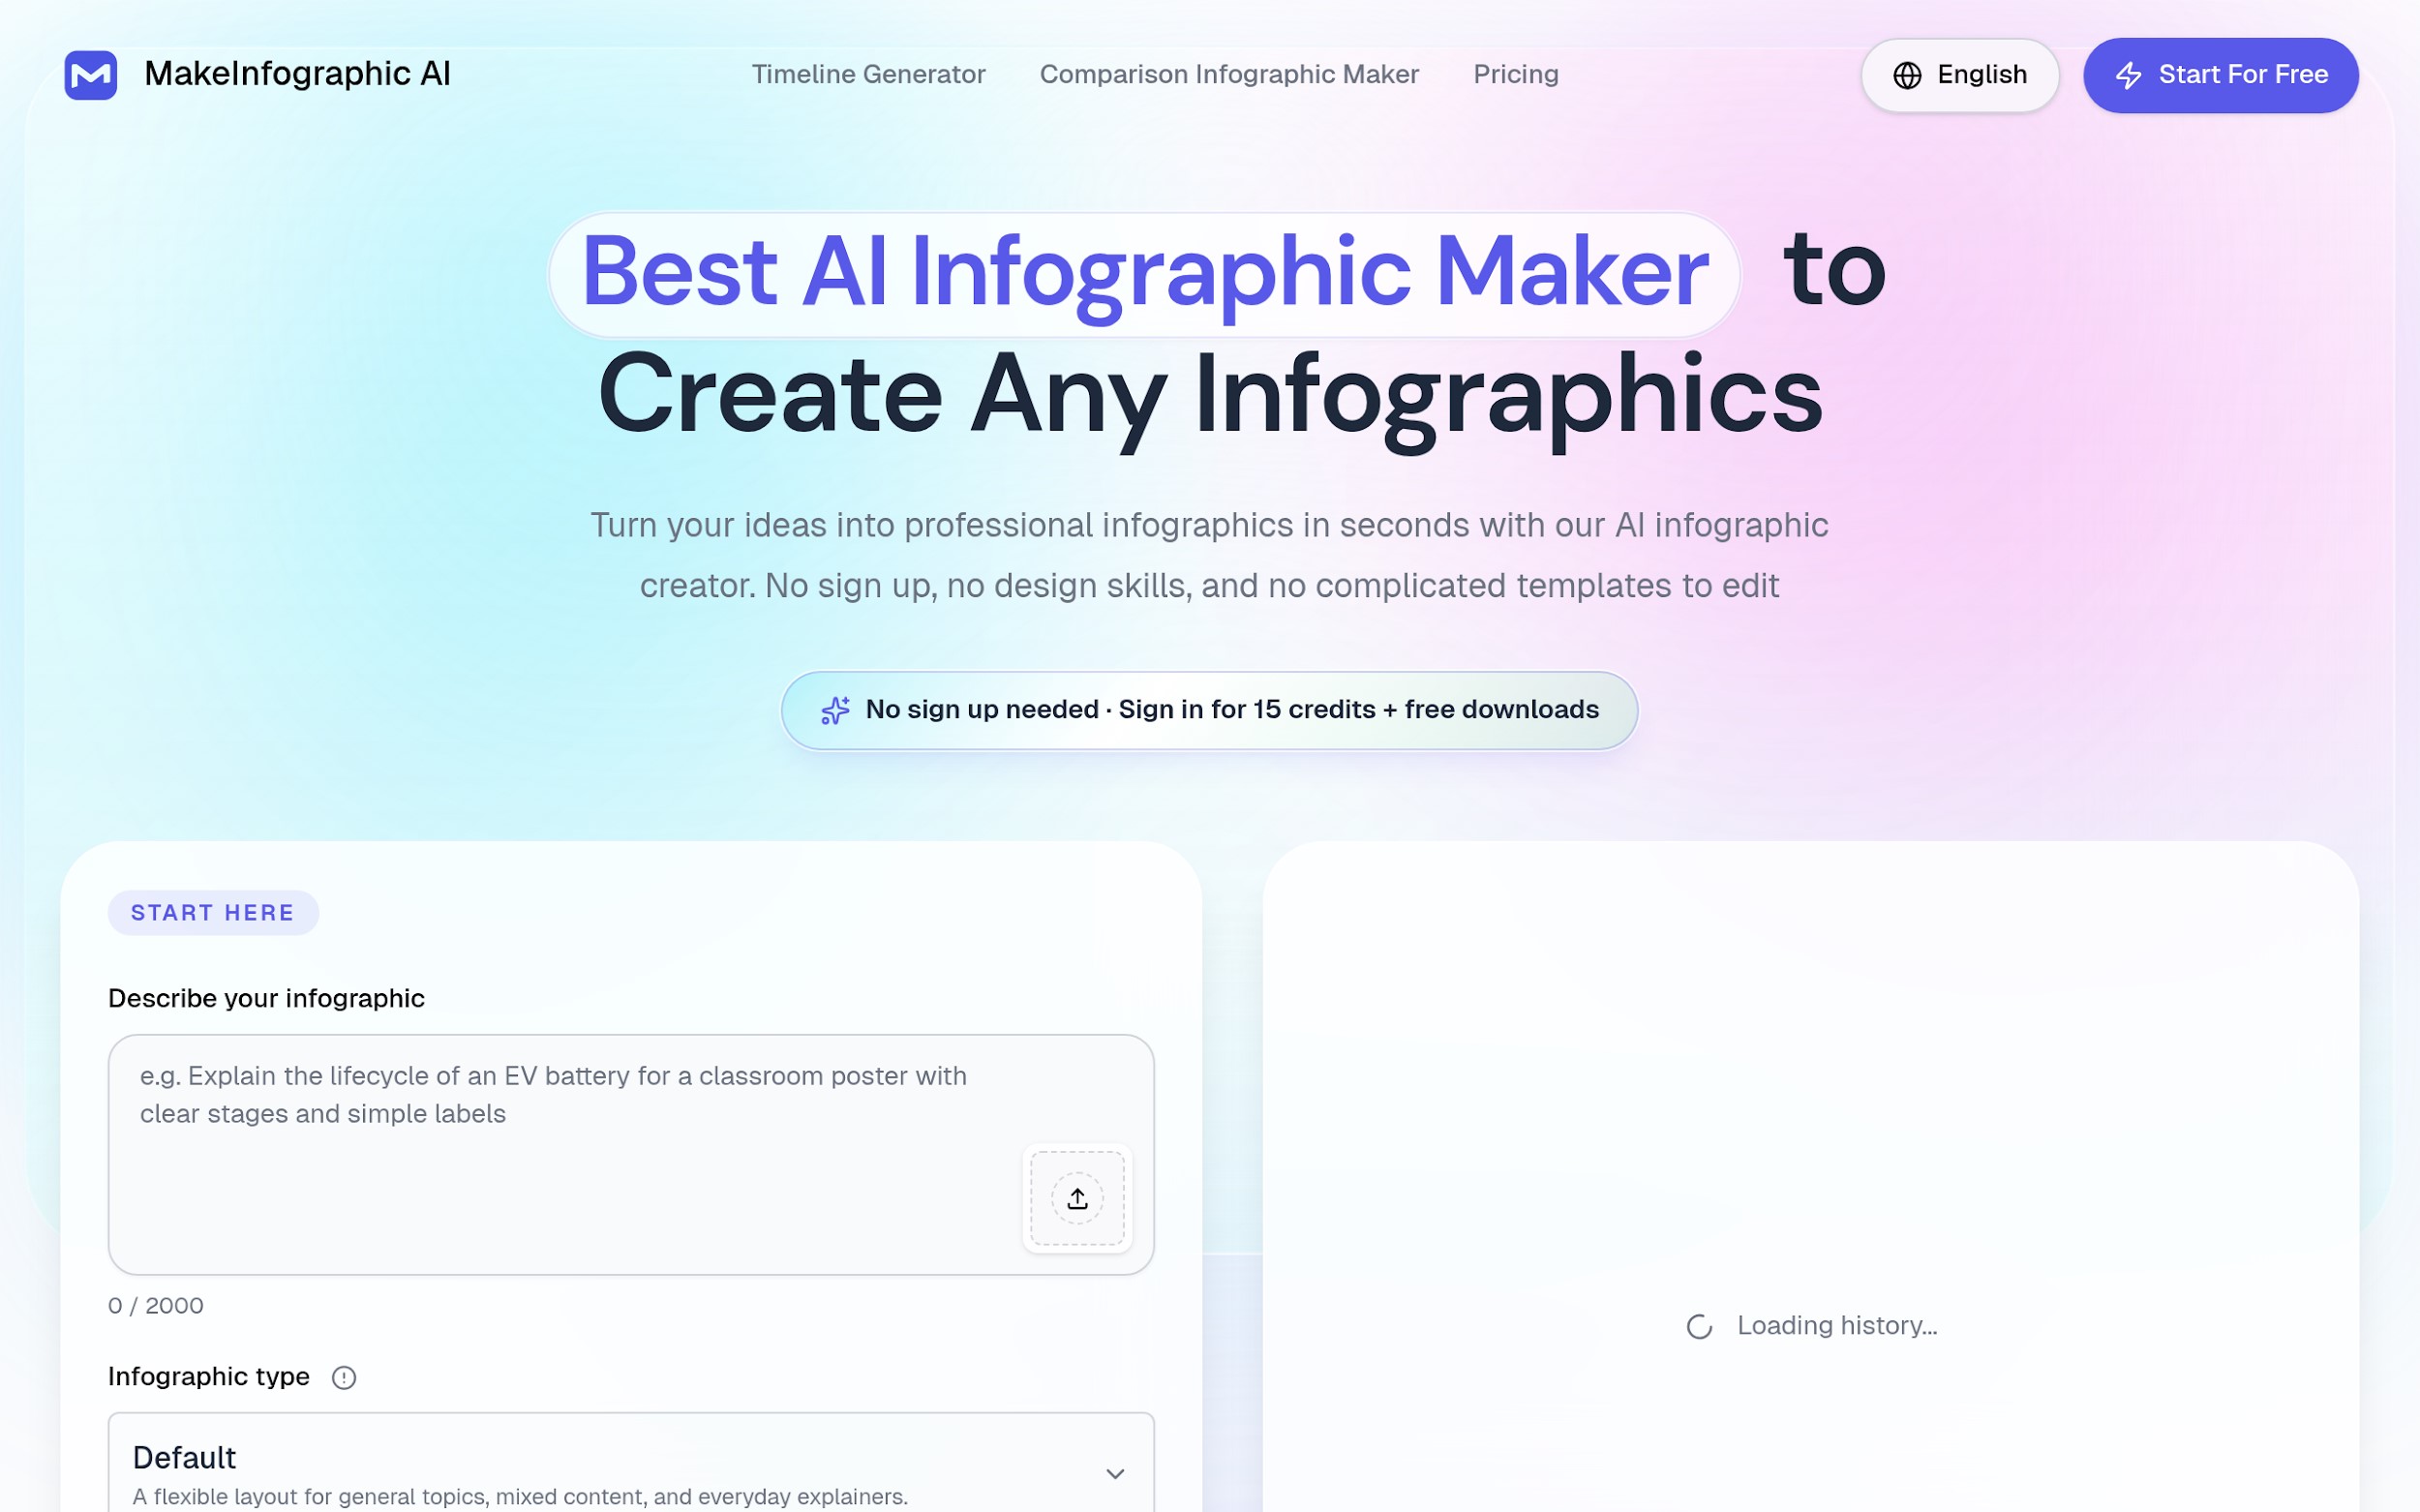
Image Source: Make Infographic AI
Make Infographic AI takes the top spot because it feels built around the exact thing most people actually want: turning a prompt into a usable infographic quickly without unnecessary friction. The homepage positioning is unusually clear. It emphasizes free access, no sign-up, instant results, and no complicated templates to edit. This is a powerful combination. Many tools on this list are strong, but they often start from a template library or a broader design platform mindset. MakeInfographic AI starts from a simpler question: what if you just want an infographic fast? The site’s actual workflow supports that low-friction positioning. The core interface centers on a prompt field, followed by a short set of useful controls: infographic type, visual style, ratio, resolution, and watermark settings. This suggests a structure-first workflow rather than a blank-canvas-first approach.
It also clearly supports infographic-specific formats such as:
- Timelines
- Comparisons
- Processes
- Pyramids
- Dashboards
- Roadmaps
- Explainers
- Decision trees
- Statistical layouts
Make Infographic AI is especially compelling for marketers, educators, and creators because it consistently positions itself around these use cases, including teachers, students, trainers, marketers, researchers, consultants, HR teams, and content creators across platforms like X, TikTok, Pinterest, Instagram, Facebook, and LinkedIn.
Its biggest advantage, however, is not just that it generates content. It also lets users download or edit the output, which is crucial. AI generation is useful, but when combined with editable refinement, it becomes far more practical in real-world workflows, especially for tools like an AI timeline generator. The trade-offs are fair: watermark customization is a Pro feature, and 4K export is subscriber-only. However, these limits do not weaken the core value. If your goal is to create infographics quickly, Make Infographic AI is the most compelling option.
2. Venngage
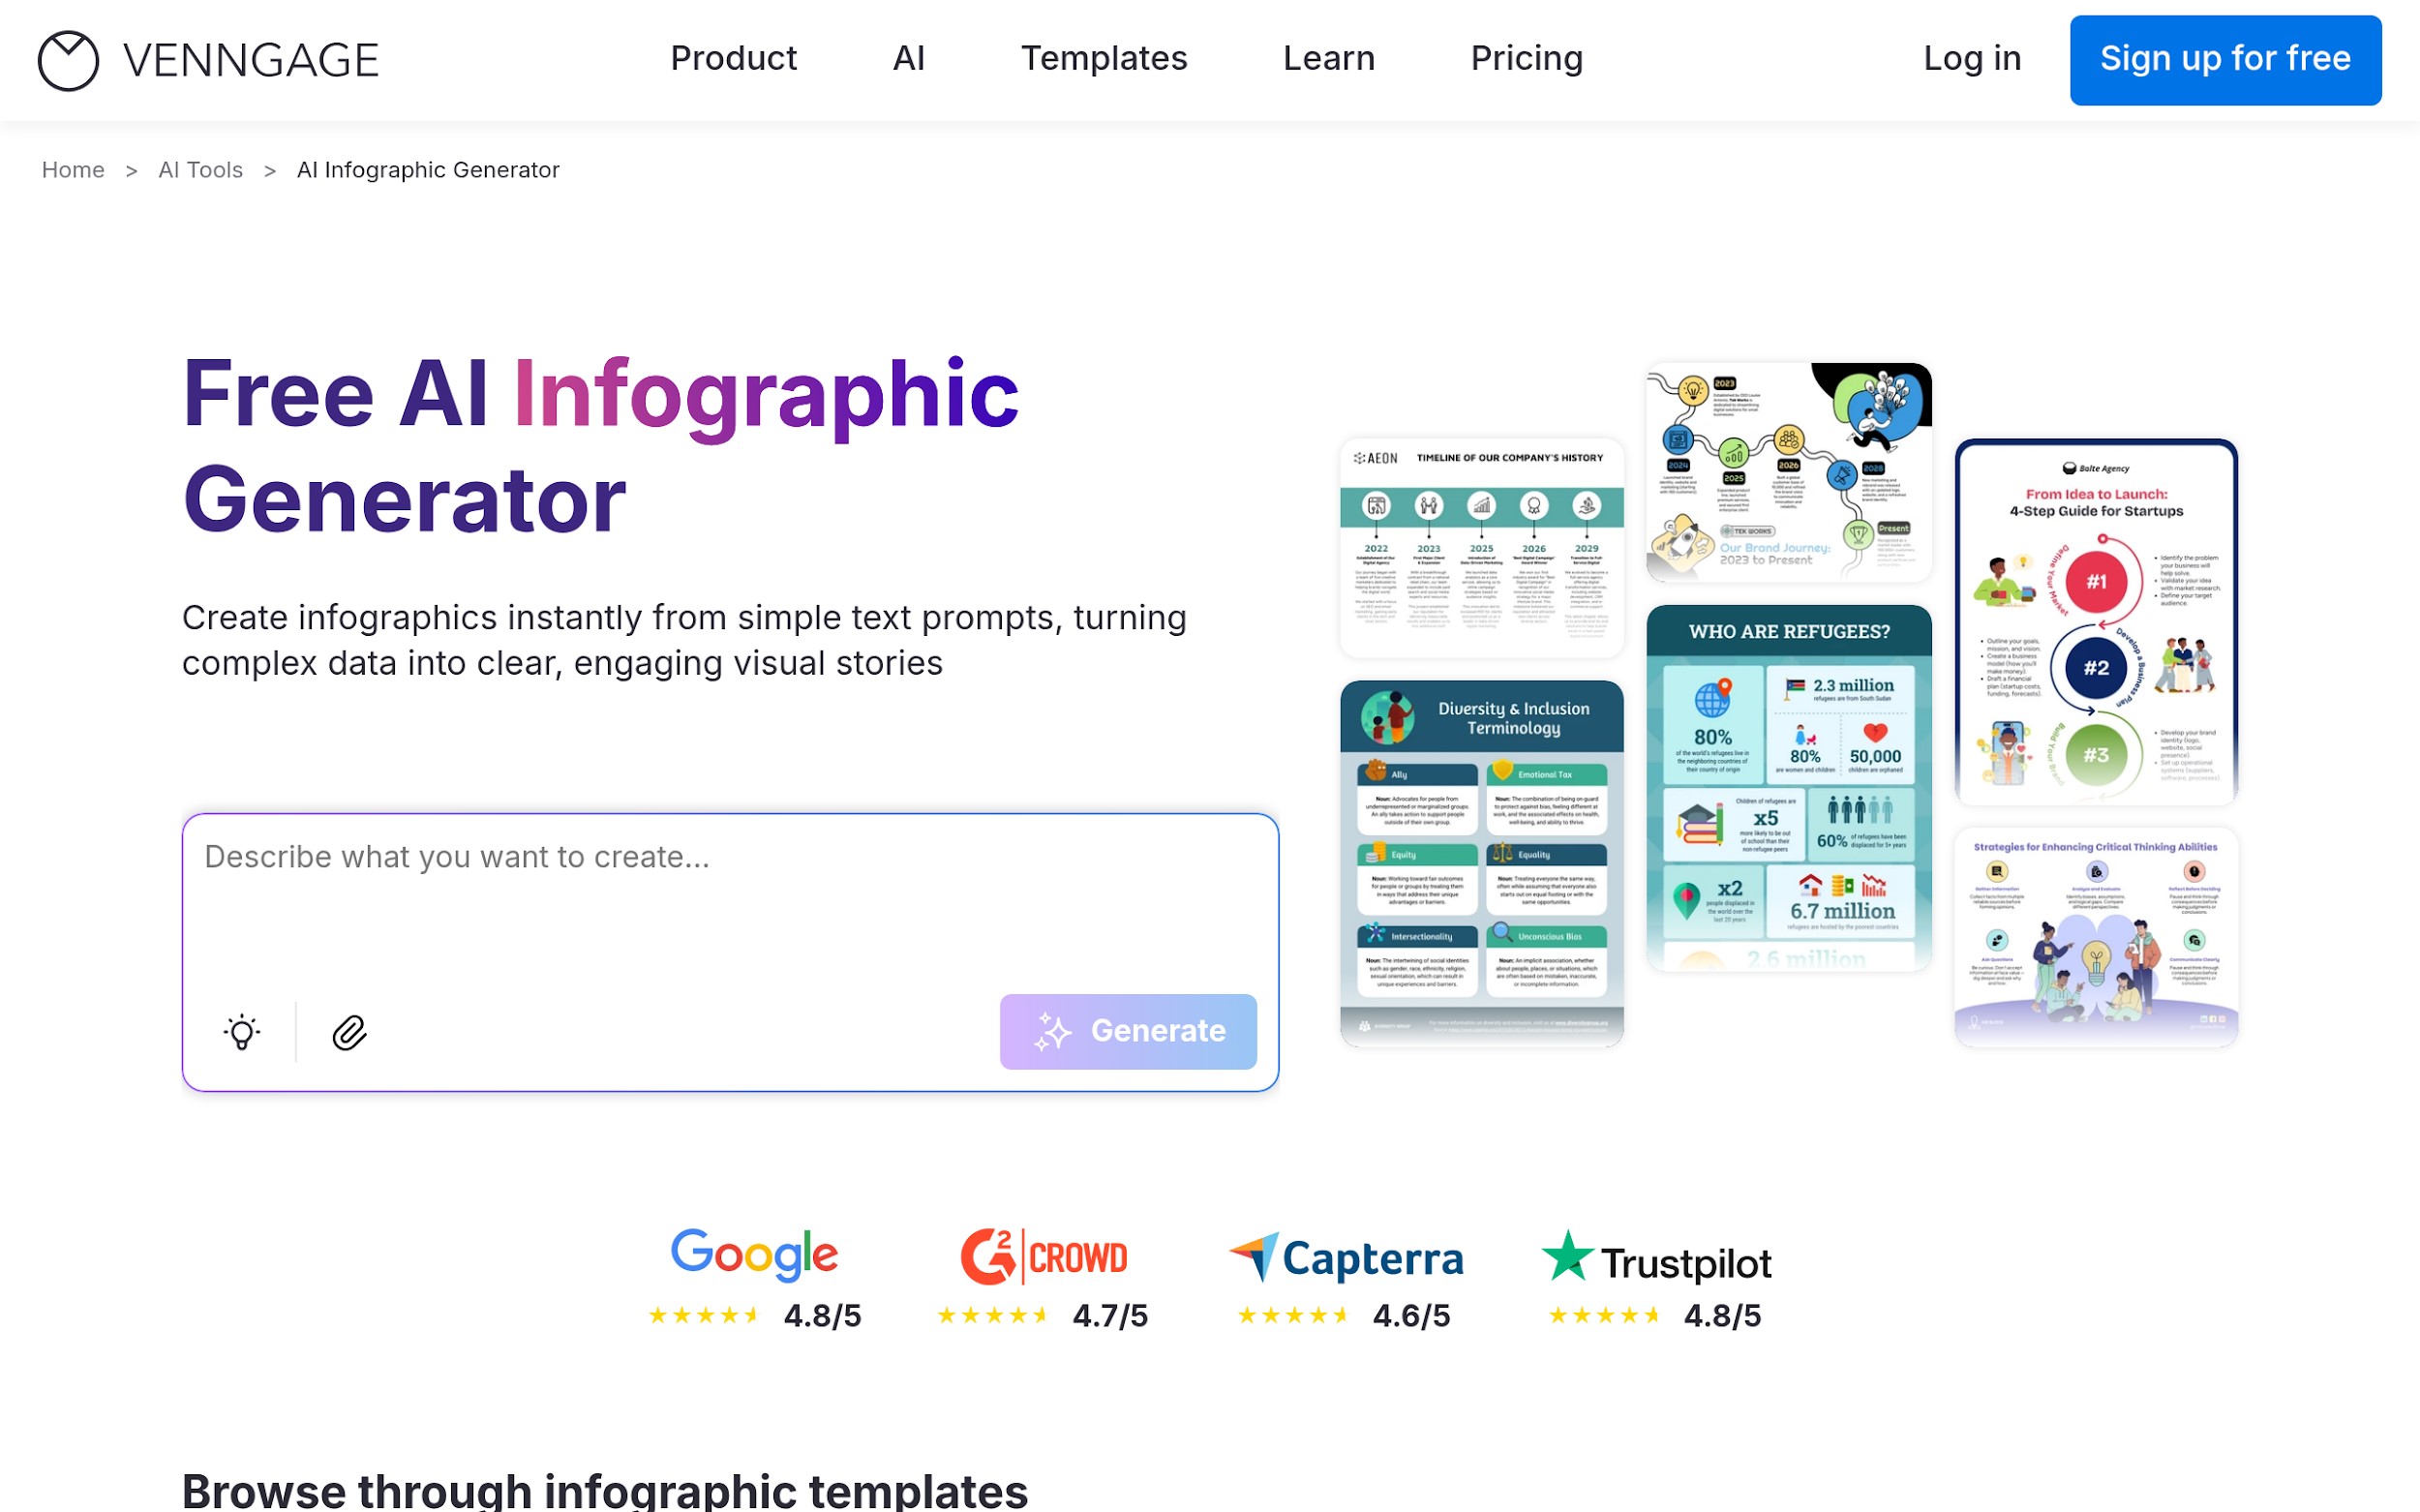
Image Source: Venngage
Venngage ranks second because it combines AI generation with a much stronger business-communication layer than many lightweight tools. Its AI infographic page positions itself around text-to-infographic in seconds, but the interesting part is how it expands that story. The product is not only about generation speed. It also highlights practical business and team features such as:
- Branding automation
- AI content auto-fill
- AI-generated icons and images
- AI writing and translation
- Smart accessibility support
- Multiple infographic template categories like timeline, list, process, informational, statistical, and comparison
That makes Venngage especially useful for users who need not only a quick infographic, but also something that fits a real brand, team workflow, or presentation environment. The prompt examples on the page are also strong. Product managers, operations managers, teachers, and consultants write them, which is a good signal because it shows people frame the tool for structured, professional communication rather than generic visual play.
For marketers and internal teams, this matters a lot. If you need to create customer-friendly feature summaries, onboarding diagrams, strategy visuals, or classroom-ready educational content, Venngage looks like a serious option. Why is it not first? For this ranking, I put more weight on low-friction creation speed and simplicity. Venngage feels broader and more polished, but also more platform-like. MakeInfographic AI still looks faster and lighter for users who just want to get moving immediately.
3. Infogram
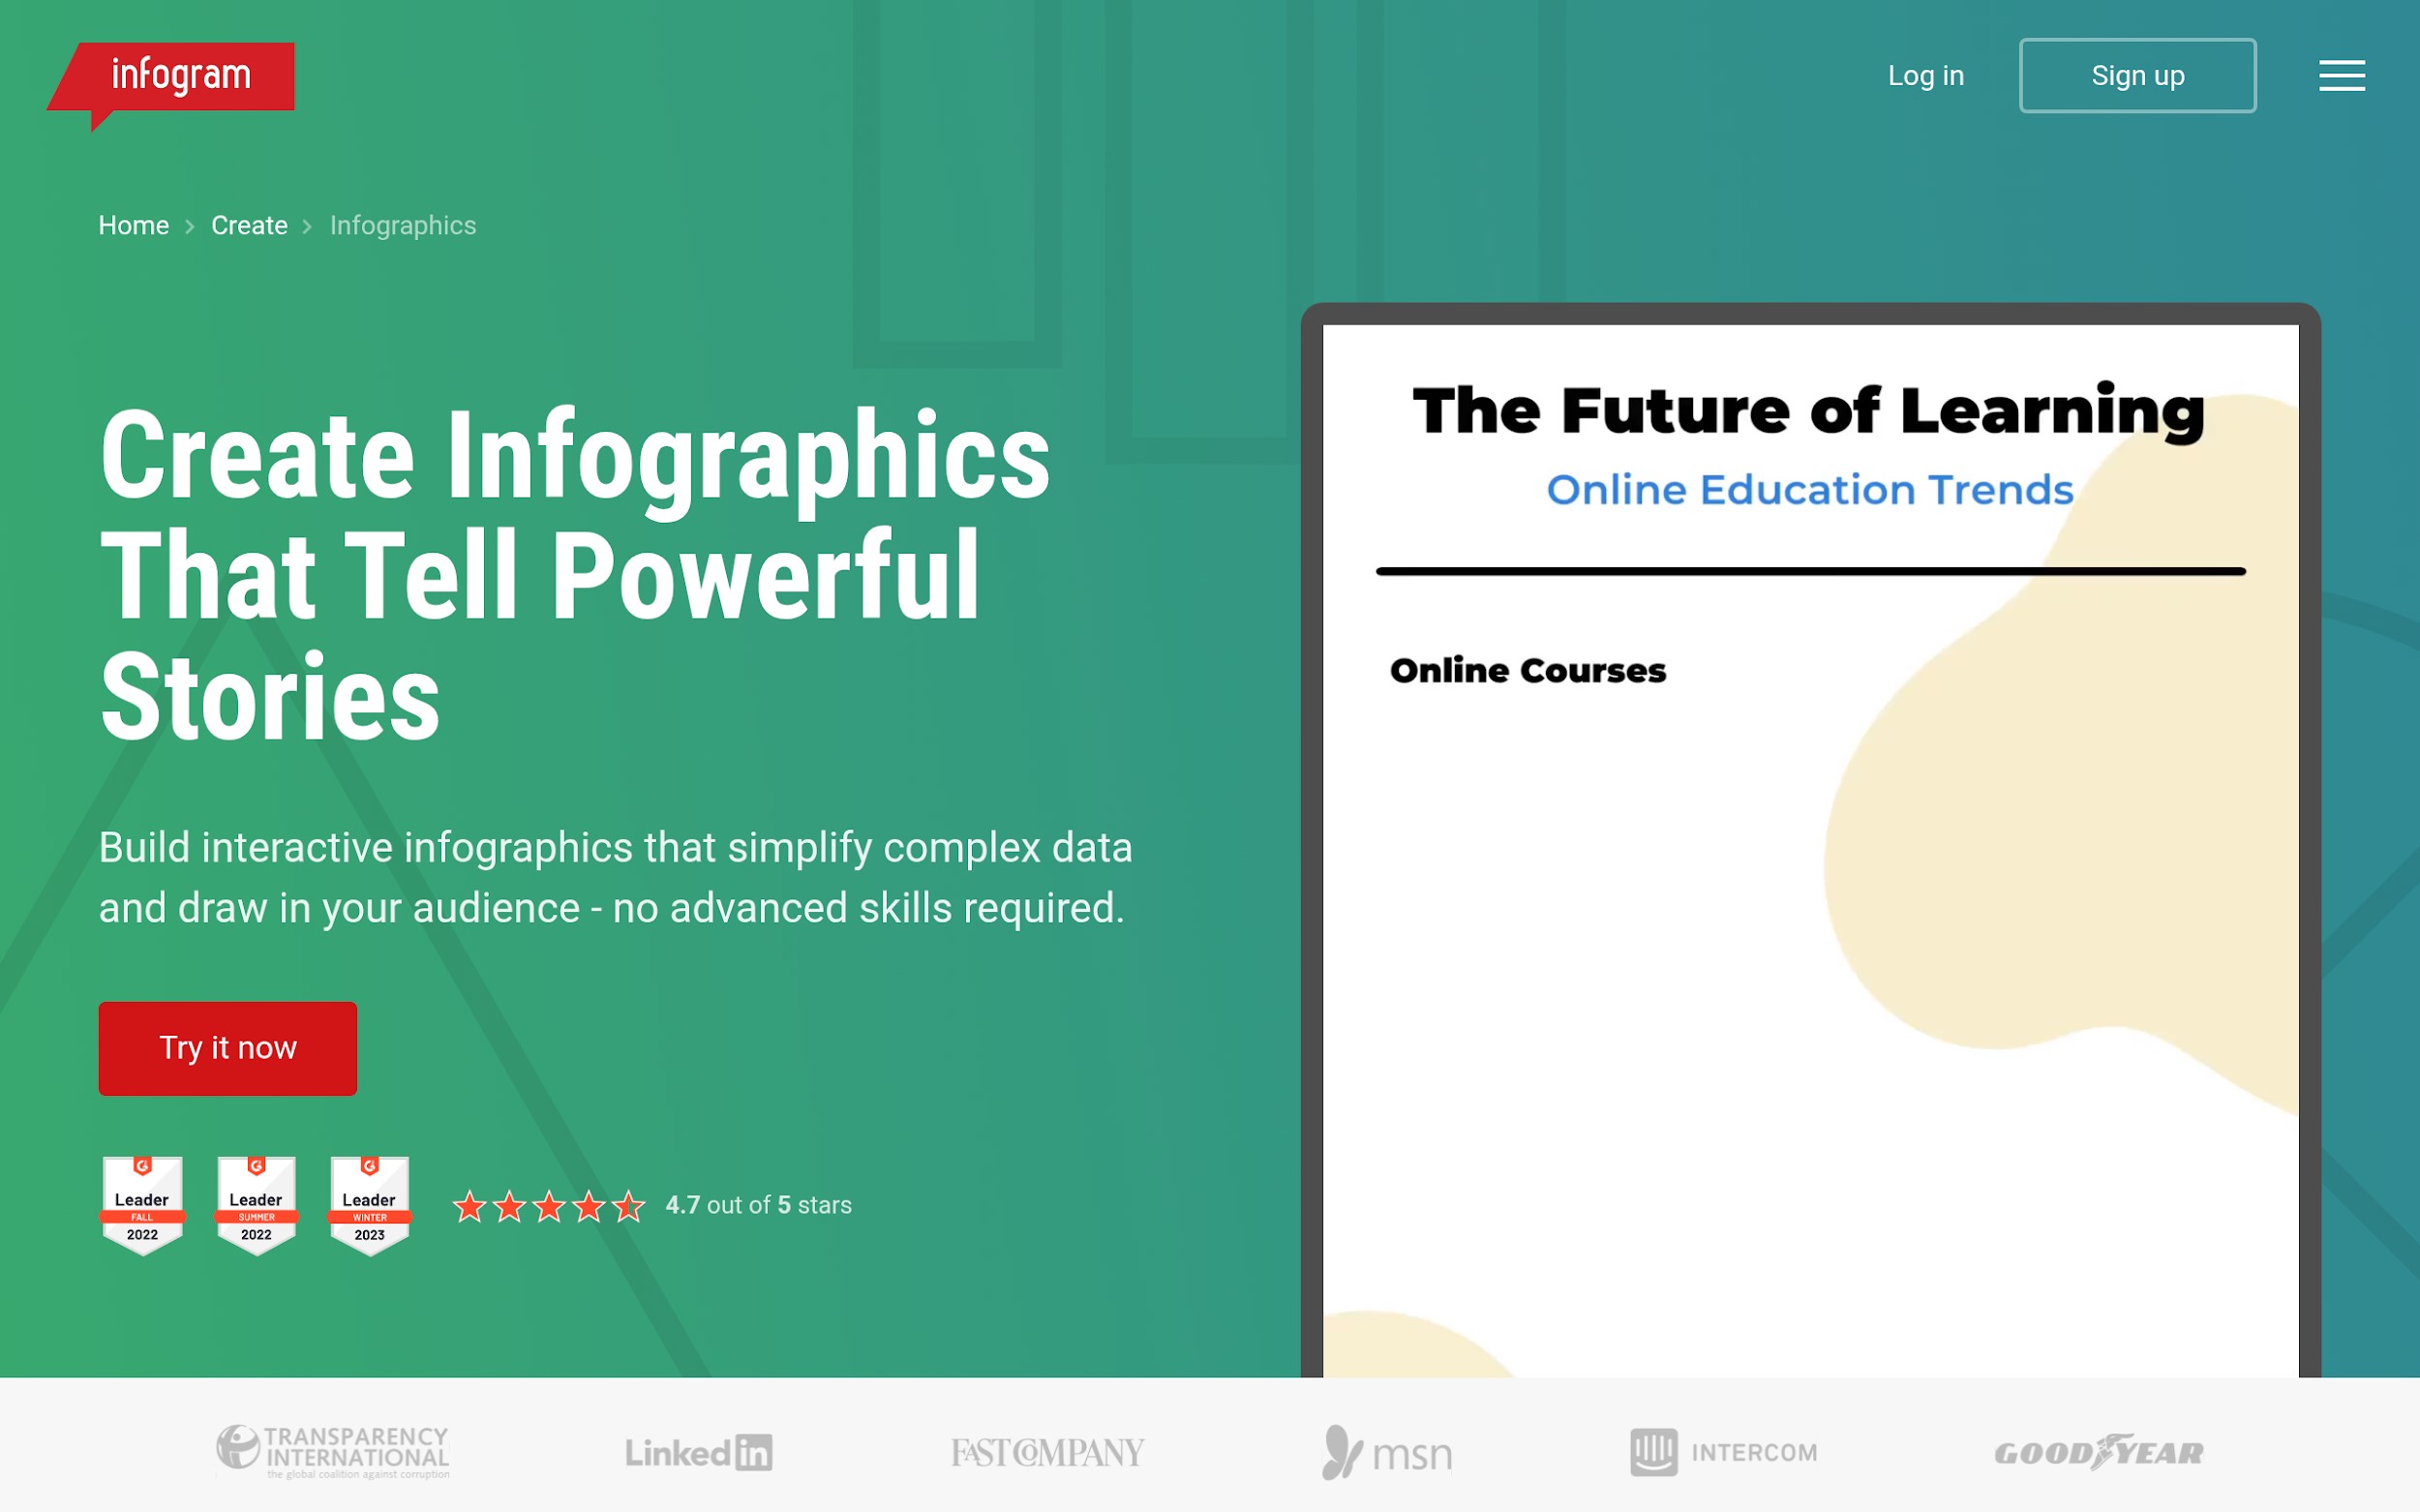
Image Source: Infogram
Infogram ranks third because it is especially strong when your infographic ties closely to data storytelling rather than pure visual summarization. Among the tools here, Infogram stands out for its emphasis on:
- Interactivity
- Animated elements
- Hover details
- 35+ chart types
- 800+ maps
- Data imports
- Analytics and engagement-oriented publishing
That positioning makes Infogram especially appealing for data journalists, investigative reporters, advocacy specialists, content marketers, and event or research teams that need more than a static poster. Its use-case framing is also sharper than average. Instead of only talking about pretty visuals, it talks about turning numbers into narratives, unpacking research, mapping evidence, and helping audiences explore information in depth.
That is why Infogram ranks above Visme and Piktochart in this list. For anyone who relies on data as much as layout in infographic work, Infogram offers a clearer specialization. Why is it third rather than second? Because it is a bit less “instant idea to quick infographic draft” than Venngage or MakeInfographic AI. It feels strongest when the content is rich, analytical, or interactive. That makes it excellent, but slightly less universal for the broad marketing/education/content audience this article targets.
4. Visme
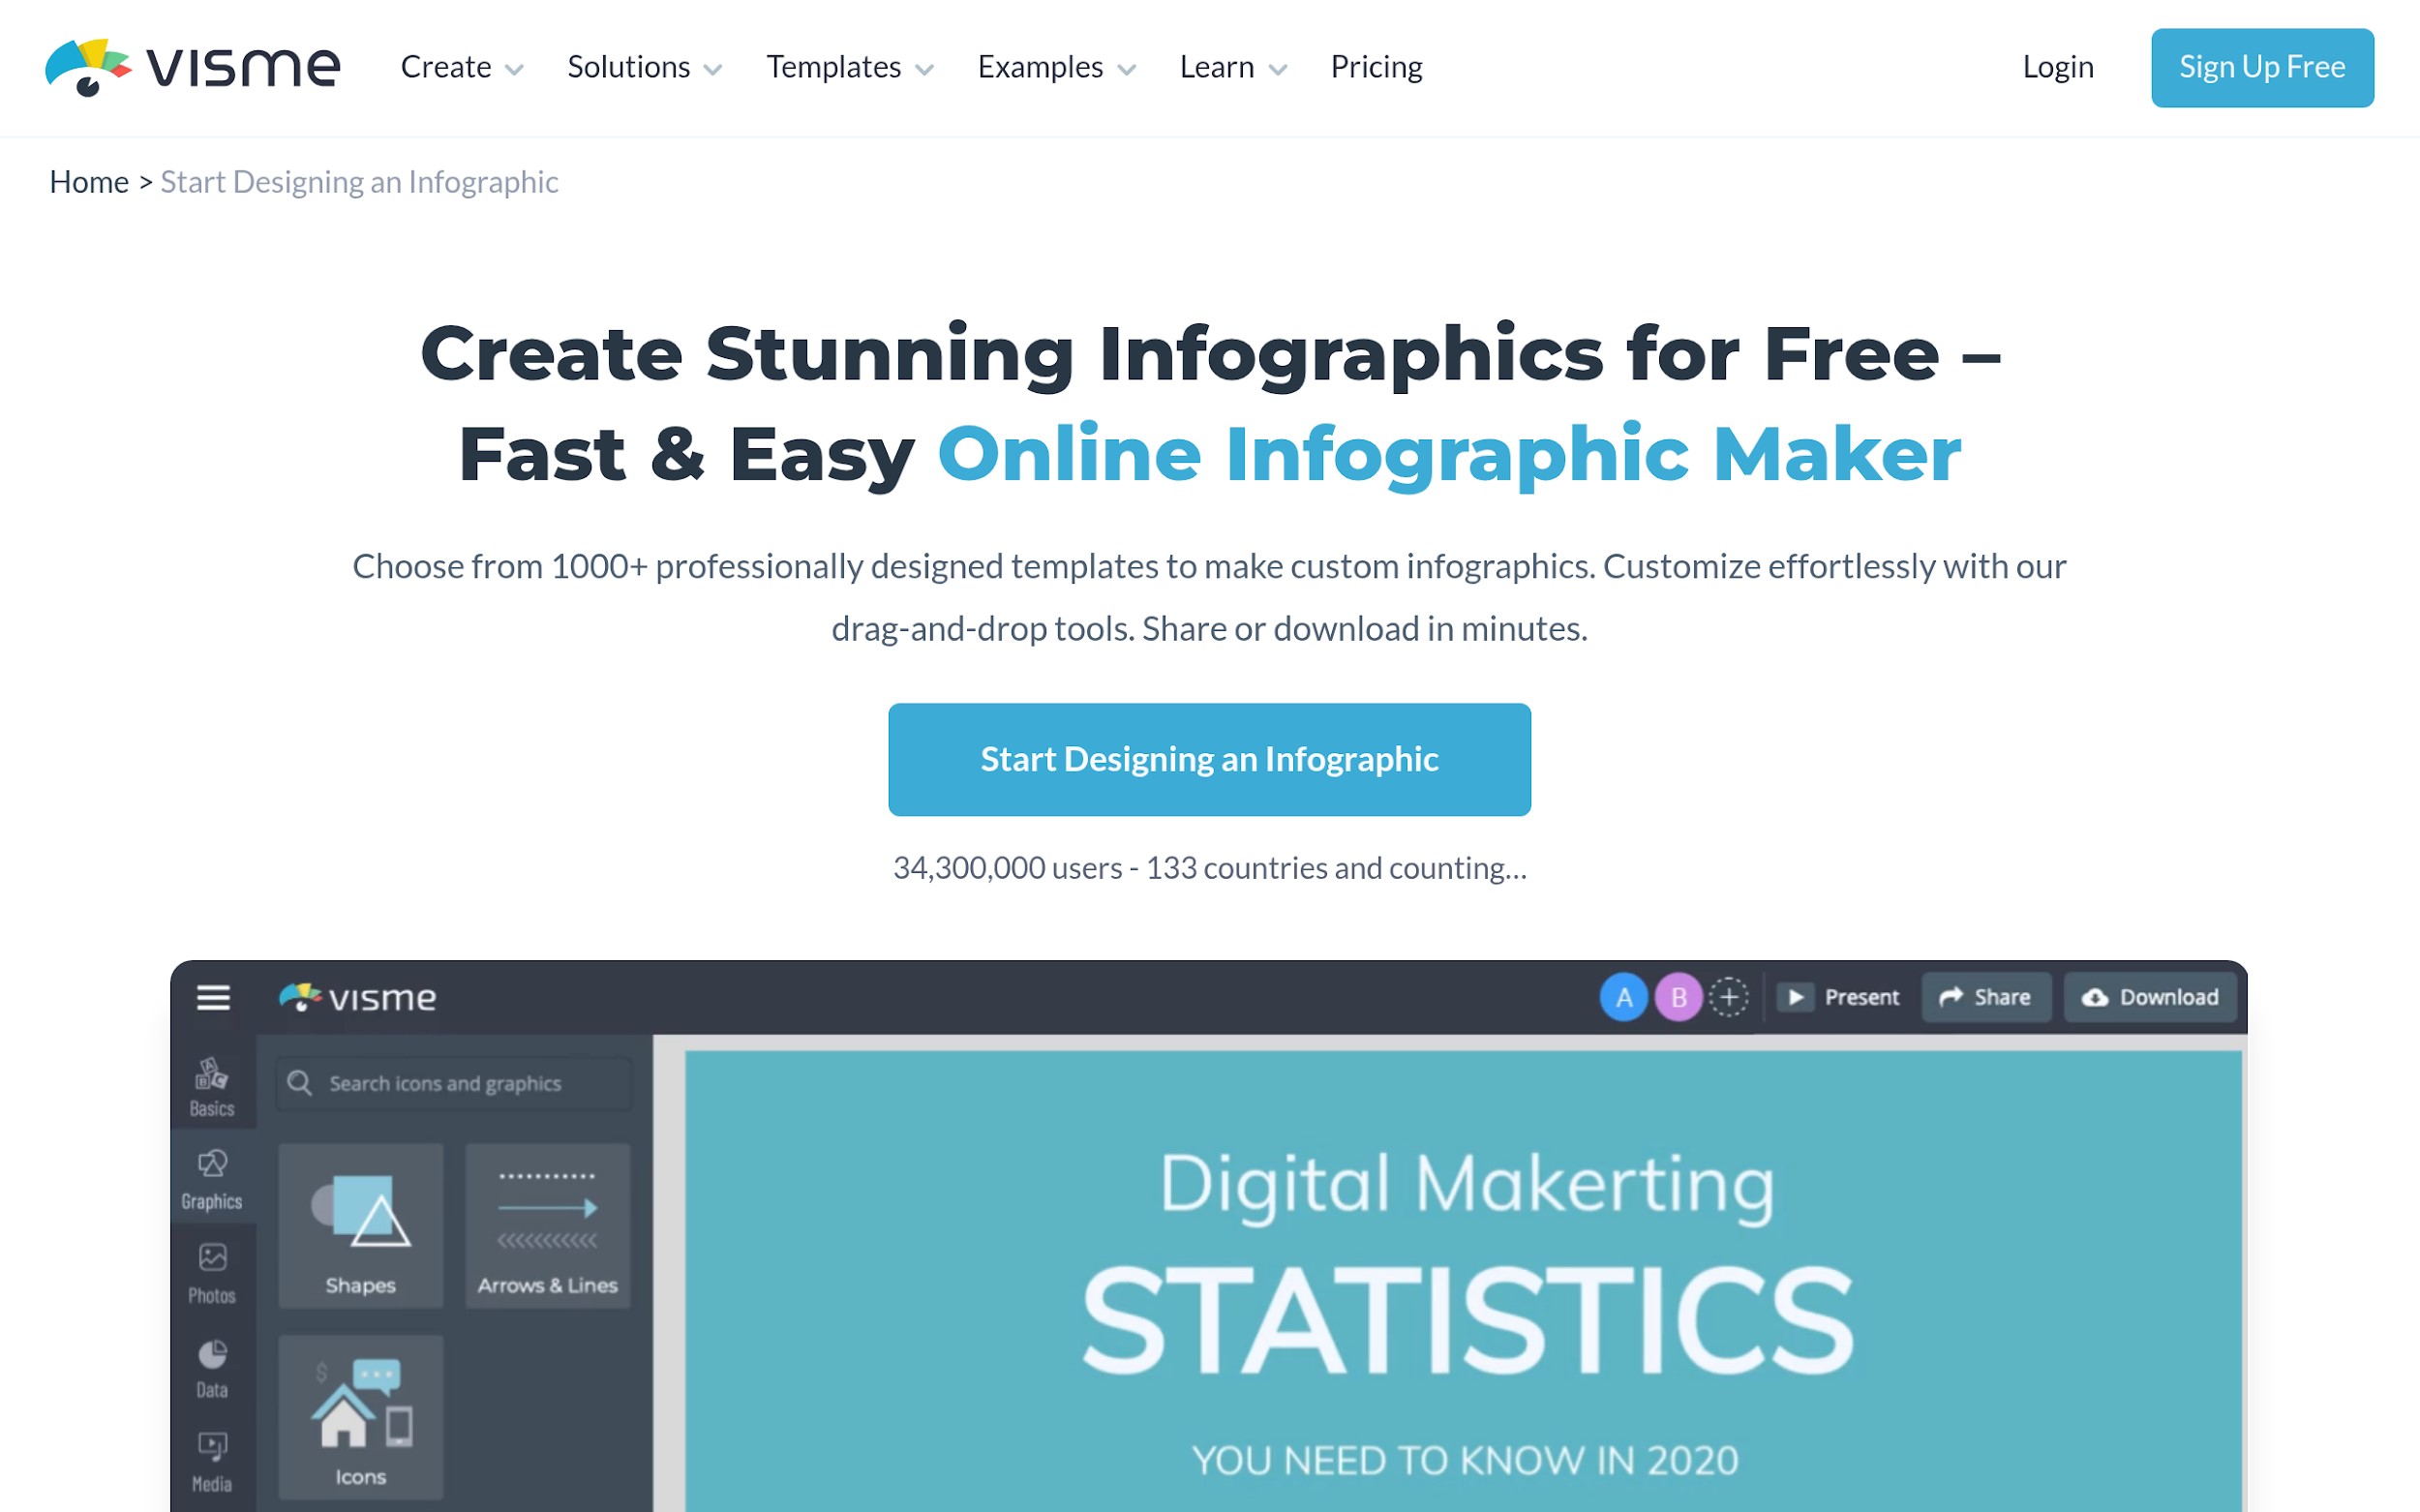
Image Source: Visme
Visme is one of the most capable tools on this list, and in some organizations, it may even be the smartest long-term platform choice. It ranks fourth here not because it is weak, but because it is broader and heavier than the faster AI-first options above it. Visme’s positioning centers on a large professional template library, drag-and-drop editing, infographic blocks, charts, diagrams, maps, brand controls, collaboration tools, and multiple sharing/export options. It supports everything from infographic creation to presentations, reports, collateral, and HTML5 interactive outputs.
That gives it a different feel from MakeInfographic AI. Instead of being primarily about fast, prompt-to-infographic generation, Visme feels more like a full visual communication platform with infographic creation as one of its major strengths. That has real value. For business professionals, researchers, educators, marketers, and consultants, Visme offers:
- Many templates and reusable content blocks
- Strong brand control
- Multiple download and sharing formats
- Collaboration and permissions features
- A large visual asset library
- Strong support for charts, diagrams, and data widgets
So why does it rank fourth? Because of the specific angle of AI infographic design tools, Visme feels less tightly focused on instant infographic generation and more focused on full editing flexibility. That can be a benefit for power users, but for quick-turn content teams, it can also mean more complexity and more time before the first usable draft appears. Still, if you want a tool that can grow with a team and handle more than infographics alone, Visme is a strong choice.
5. Piktochart
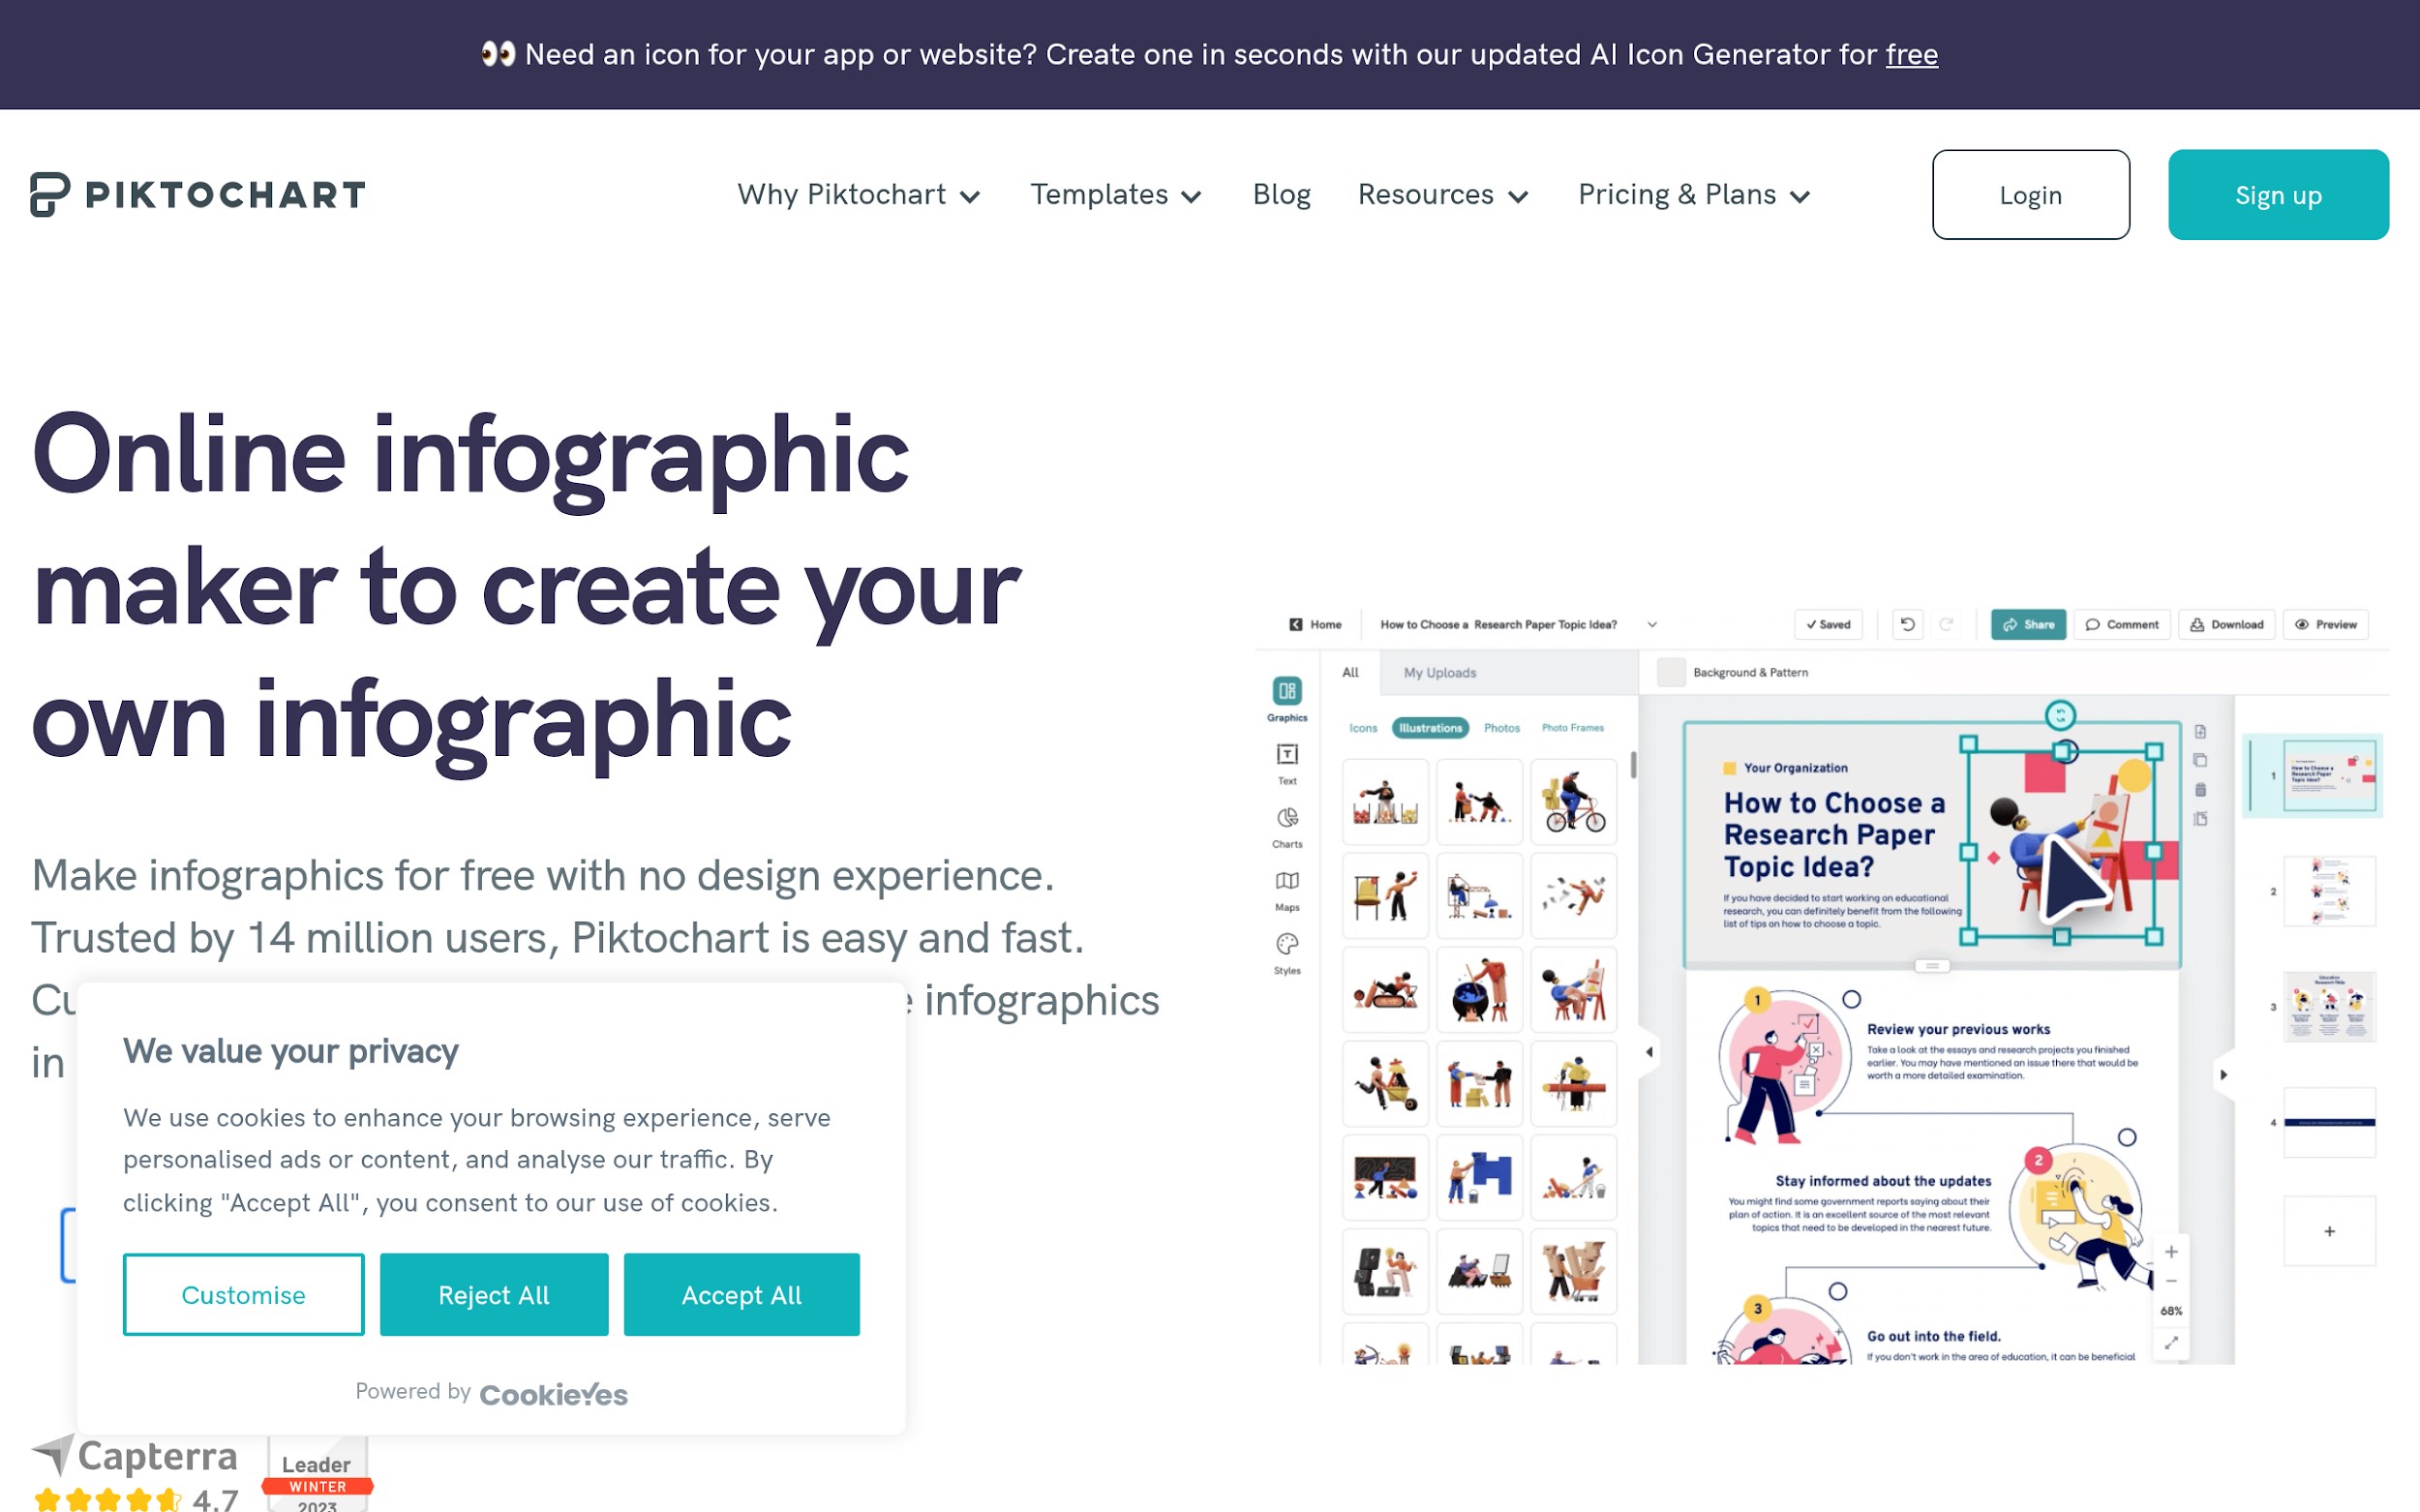
Image Source: Piktochart
Piktochart takes the fifth spot, and it still deserves to be here. The platform has a strong, long-standing reputation for helping non-designers create infographics, and its positioning is still very practical. It emphasizes free infographic maker, ease of use, strong templates, and broad relevance for marketers, HR teams, educators, nonprofits, and healthcare professionals. It also has a very approachable workflow:
- Log in
- Pick a template
- Customize the infographic
- Add images/icons/assets
- Download and share
That clarity is a strength. For many users, especially those who prefer starting from a proven template rather than a prompt, Piktochart remains very useful. The product messaging also highlights some attractive advantages:
- Easy creation for non-designers
- Broad template support
- Drag-and-drop customization
- Multiple asset types
- Watermark-free positioning in the reviewed copy
- Strong educational and business use cases
So why is it fifth? Mainly because the reviewed material feels more template-first than AI-first. In other words, Piktochart still looks excellent for infographic creation, but it feels less differentiated as an AI infographic design tool than the others above it. That does not make it a bad option. It just means the tools above it appear better matched to users who want stronger AI assistance at the start of the workflow.
Quick Comparison Table
| Tool | Best for | Main strength | Main trade-off |
| MakeInfographic AI | Fast infographic creation for marketers, educators, and creators | No-sign-up, prompt-first, structure-first workflow | Watermark customization and 4K export are gated |
| Venngage | Brand-friendly business and educational visuals | AI generation plus branding, accessibility, and template depth | More platform-like and less low-friction than MakeInfographic AI |
| Infogram | Interactive, data-rich storytelling | Charts, maps, interactivity, and analytical communication | Less focused on the fastest lightweight creation flow |
| Visme | Teams needing a broader visual content platform | Deep template library, assets, collaboration, and export flexibility | Heavier editor experience and more setup than AI-first tools |
| Piktochart | Template-led infographic creation for non-designers | Easy, approachable template workflow with a broad audience fit | Less clearly differentiated on AI-first infographic generation |
Which Are the Best AI Infographic Design Tools for You?
If you want the simplest answer, here it is:
- Choose MakeInfographic AI if your priority is getting from idea to infographic fast.
- Choose Venngage if you want a stronger brand, accessibility, and business-ready polish.
- Choose Infogram if your infographic work depends heavily on data, interactivity, and analytical storytelling.
- Choose Visme if you want a bigger, all-purpose visual content platform with infographic depth.
- Choose Piktochart if you prefer a dependable template-led experience designed for non-designers.
For marketers, educators, and content creators specifically, the first recommendation remains MakeInfographic AI, as it removes more friction than the others. Its workflow feels more direct, more focused, and more aligned with how people actually want to create infographic content today.
Final Thoughts
The market for the best AI infographic design tools is growing rapidly, but each tool solves a different problem. Some tools focus on speed, some on branding, and others on data visualization or templates. However, if your main goal is to create fast, structured infographics, Make Infographic AI stands out as the most efficient option. Venngage is the strongest for business-ready design, Infogram excels in data storytelling, Visme is best for all-in-one visual content needs, and Piktochart remains a reliable beginner-friendly option. Ultimately, the best AI infographic design tools are the ones that reduce effort while improving clarity and that is exactly what this new generation of AI tools delivers.
Recommended Articles
We hope this comprehensive guide to AI infographic design tools helps you create more impactful and visually engaging content with ease. Check out these recommended articles for more insights and strategies to enhance your design workflow and improve your success in content creation.

